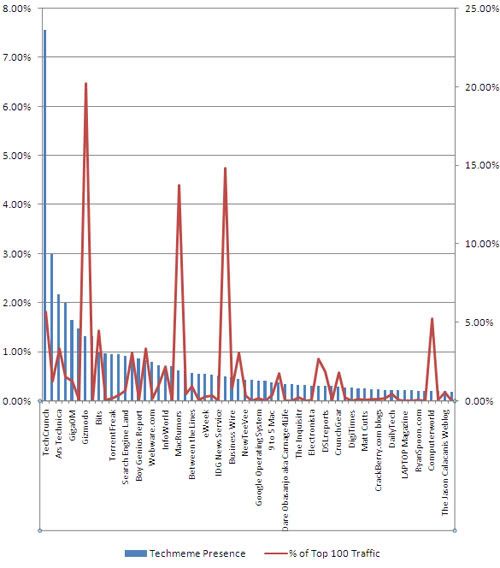
One of the appeals of Techmeme is it's transparent, always updated leaderboard. Techmeme ranks it's top 100 contributors by the number of headlines each blog sends to the homepage. The ratio of overall headlines to a specific blogs headlines is called "presence". Techcrunch, for instance, represents 7.56% of Techmeme's headlines during the last 30 days - a very significant portion considering that no other blog contributes over 3% and only 7 other blogs have over 1%. I've looked at Techmeme's Top 100 contributors before, but this time I wanted to place each of the top 100's Presence against monthly traffic (monthly unique visitors). To pull traffic numbers, I used Quantcast (of note: a very large portion of the sites were 'Quantified') and removed all major publications from the data (Fortune, WSJ, AP, etc)... I wanted to focus on blogs and felt that those publications would cloud that data considering their larger audiences and extensive websites (much of which was irrelevant to Techmeme).
Techmeme publishes its Top 100 sites by Presence. After removing the major publications and collecting traffic data, I then recharted the results by what I refer to as "Network Presence" (the portion of traffic that a particular site represents as compared to the collective traffic of the Techmeme Top 100).
The interesting part is that those leaderboards are *very* different. I pulled the 10 best and 10 worst differentials to highlight those differences.
It seems very intuitive but:
- Technology / gadget blogs have very high Network Presences that outweigh their Techmeme Presence - Conversely, industry and web 2.0 blogs see a lot of Techmeme coverage but don't generate a representative amount of traffic
A couple conclusions are:
- While Techmeme gets heat for favoring bigger blogs, the Network Presence data suggests this isn't true - Having strong Techmeme Presence doesn't equate into big traffic numbers... but Techmeme probably represents a good portion of that traffic - Techmeme links to a fair amount of gagdet news - but considering their high volume of traffic, Techmeme probably isn't a top referrer
Techmeme's Top 25 by Presence 1 TechCrunch 7.56% 2 ReadWriteWeb 2.99% 3 Ars Technica 2.18% 4 Silicon Alley Insider 2.01% 5 GigaOM 1.66% 6 BoomTown 1.49% 7 Gizmodo 1.33% 8 VentureBeat 1.33% 9 Bits 0.99% 10 paidContent.org 0.98% 11 TorrentFreak 0.95% 12 Scobleizer 0.95% 13 Search Engine Land 0.93% 14 Engadget 0.89% 15 Boy Genius Report 0.88% 16 AppleInsider 0.83% 17 Webware.com 0.80% 18 Techdirt 0.73% 19 InfoWorld 0.72% 20 A VC 0.72% 21 MacRumors 0.63% 22 O'Reilly Radar 0.62% 23 Between the Lines 0.58% 24 Google Blogoscoped 0.56% 25 eWeek 0.56%
Top 25 of Techmeme's Network Presence 1 Gizmodo 20.22% 2 Lifehacker 14.82% 3 MacRumors 13.76% 4 TechCrunch 5.65% 5 Computerworld 5.25% 6 Bits 4.50% 7 AppleInsider 3.32% 8 Ars Technica 3.32% 9 Engadget 3.07% 10 PR Newswire 3.07% 11 Valleywag 2.66% 12 InfoWorld 2.19% 13 DSLreports 1.88% 14 CrunchGear 1.80% 15 Mashable! 1.76% 16 Silicon Alley Insider 1.51% 17 ReadWriteWeb 1.28% 18 GigaOM 1.24% 19 Techdirt 0.97% 20 Between the Lines 0.93% 21 Business Wire 0.83% 22 Search Engine Land 0.65% 23 Jason Calacanis Weblog 0.55% 24 O'Reilly Radar 0.44% 25 DailyTech 0.44%
10 Worst Differentials (Traffic Outweighs Presence) 1. Gizmodo -18.89% 2. Lifehacker -14.31% 3. MacRumors -13.13% 4. Computerworld -5.04% 5. Bits -3.51% 6. PR Newswire -2.62% 7. AppleInsider -2.49% 8. Valleywag -2.35% 9. Engadget -2.18% 10. DSLreports -1.57%
Ten Best Differentials (Presence Outweighs Traffic) 1. TechCrunch 1.91% 2. ReadWriteWeb 1.71% 3. BoomTown 1.45% 4. VentureBeat 1.26% 5. paidContent.org 0.95% 6. Boy Genius Report 0.83% 7. TorrentFreak 0.80% 8. A VC 0.70% 9. Webware.com 0.61% 10. Scobleizer 0.54%
Techmeme Presence vs. Monthly Traffic
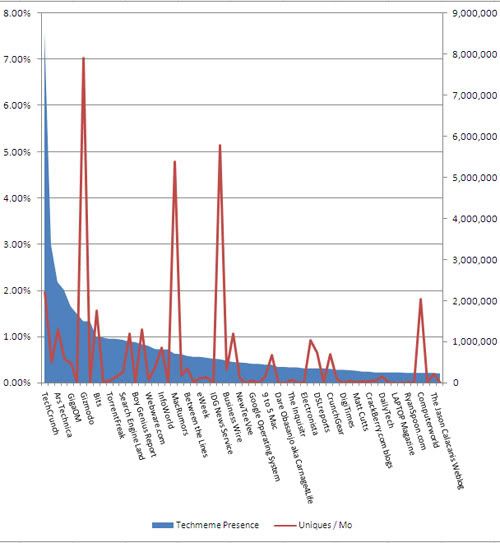
Techmeme Presence vs. Network Presence