Mobile Accounts for 12.5% of Visits... and Other Interesting Stats From this Blog

Every so often I like to dig into this blog's traffic and see what it reveals. This time I was sparked by a Quora conversation about how bloggers use Google Analytics. I looked at traffic from the last 30 days and since January 1st.

Three things jump out:

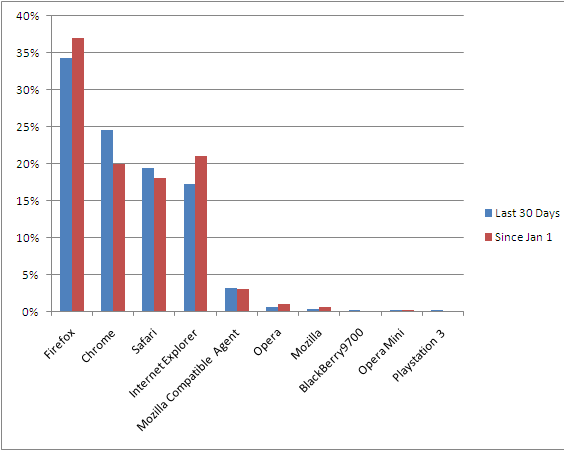
1. 12.5% of my readership is now via mobile devices. That is up from 8% since January 1st. Considering its a content blog, 12.5% is a large amount and it represents a +50% gain.

2. Chrome has emerged as the #2 browser after a significant gain (25% from 18%). Meanwhile, Firefox and Internet Explorer both lost share (37% to 34% and 20% to 17%).

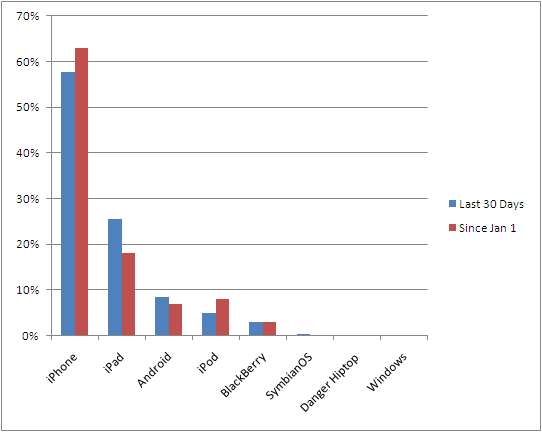
3. For Mobile usage, the iPhone and iPad are the clear #1 and #2. Amazingly, the iPad now accounts for 26% of all mobile visits. It has clearly eaten into the iPhone (which fell from 63% to 58%). Android has been relatively stable - 8% of visits over the last 30 days and 7% since Jan 1.

Of course this is biased data (from a tech blog) from a relatively small sample size (10,000+ monthly uniques).

Amidst Facebook Places, Dont Forget Google Places (Now with Coupons)

Lost among the hubbub surrounding the similarly named Facebook Places is Google's local product: Google Places. It might not include check-ins, but it is a product aimed at local businesses and search queries... and tied to Google's core competency and model. Google Places is: Yelp + AdWords + Google Analytics + Groupon. It's powerful.

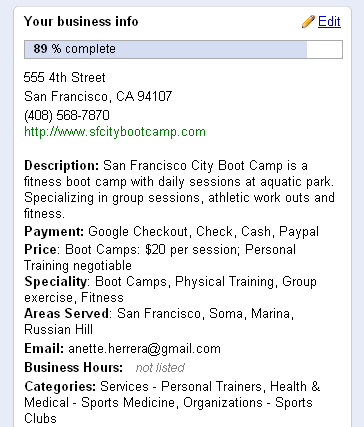
Tied to Google's local search - which is integrated into core search, mobile and Google Maps - Google Places allows businesses to create profiles of themselves. These profiles supplement search results with content, pictures, etc.

For consumers or searchers, this means deeper and more actionable content. For business owners, this means that Google can provide analytics about searches / searchers... and of course get you to advertise against them. This includes:

A business dashboard (analytics) and advertising / coupon center:

A communications platform to broadcast content / events:

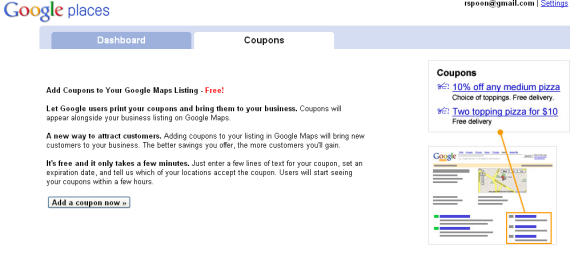
And a mobile / print couponing platform - of course tied to Google's mobile and maps platform:

And of course, Google is capable of promoting Places heavily through their content network (below is an example ad unit from this blog) and through Google's other popular products:

Long Tail Analytics with Quantcast, Google Trends & Compete - Who Wins?

Google entered the public web analytics game yesterday by expanding Google Trends beyond search queries and into web traffic. Just a couple years ago, we had two options for web data: - Comscore provided detailed analytics for the web's top sites - Alexa (inaccurately) estimated traffic based on their tool bar users / usage

Now, we have three major players offering analytics for the tail of websites: Quantcast, Compete and Google Trends. Quantcast is, at this point, the only player that enables publishers to add tags to their site (or media: flash, network, etc) that effectively share their stats and make them public. This gives Quantcast full information about the site and its visitors (the same way that Google Analytics collects their data); they then share a portion of that information publicly and, for quantified publishers, that data should be trusted: pageviews, uniques, visits, etc. The beauty of what Quantcast has built is that publishers are incented to 'quantify' their sites because it provides a trusted 3rd party representation of their traffic - and for the tail of websites, that's an important differentiator because Comscore only measures the web's top sites.

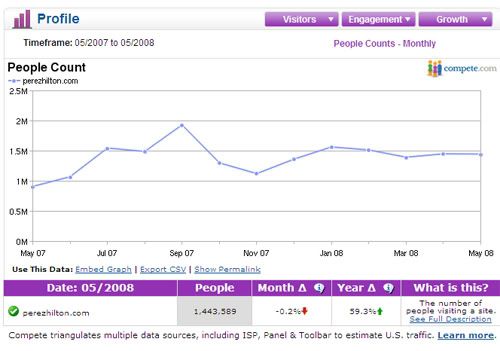
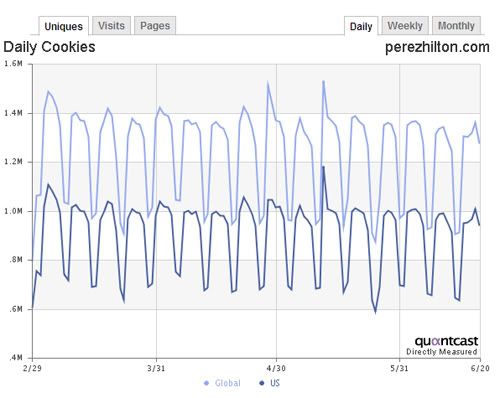
Meanwhile, Compete collects their data from a panel of users and releases monthly stats (for quantified publishers, Quantcast releases daily updates). Below, you'll see just how different Quantcast and Compete are for PerezHilton.com (who is now quantified). Quantcast shows 9 million monthly uniques and 1.4 million daily uniques - Compete shows about 1.4 million monthly uniques. Big difference:

According to the data (3m uniques vs. 1m) and all of my anecdotal Silicon Valley conversations, Quantcast seems to be the preferred analytics provider over Compete.... but the real wildcard is clearly Google. The Google Trends launch garnered huge buzz yesterday - but it's yet to be seen how big of a step Google is actually taking. You'll notice below that Google Trends shows 600k daily uniques for PerezHilton.com - which falls between Quantcast and Compete... which leads to me to ask the obvious question: Will Google open up Google Analytics publicly on an opt-in basis? Quantcast has pushed Compete aside by gathering real data provided directly by the website owner. Google already has a massive footprint in Analytics - by providing an option to "make your data public", they can create a consumer-facing analytics service and extend the reach of AdWords / AdSense by matching demographics and allowing direct ad-buying.

The integration is easy and leverages Analytics massive user base. More importantly, it delivers accurate data and makes Google Trends relevant - because, as it currently stands, the data is good just that: trends.

Google Trends Launches - Apparently I'm Techmeme's 3rd Most Overlapped Site? (No Way!)

Google today announced that they are moving Google Trends closer towards Quantcast and Compete's territories... This is potentially big news - but it depends on how transparent Google decides to be and how well integrated they work with Google Analytics. I've written before that Analytics users should have the option to turn their data public... I'm not sure if this is actually the first step in this direction, but it doesn't appear that way with this current release (which reveals trends without numbers). It is also clear that Google has some work to be done. Below is the Trends chart for Techmeme and apparently my blog is Techmeme's 3rd most overlapped ("also visited") website. I wish that were true... but I doubt it!

Google trends for Techmeme:

Also visited: 1. scobleizer.com 2. inquisitr.com 3. ryanspoon.com 4. louisgray.com 5. centernetworks.com 6. memeorandum.com 7. summize.com 8. friendfeed.com 9. furrier.org 10. gigaom.com

Google Analytics - 20 Ways to Fix Analytics. Please Hurry?

I’ve written a lot about web analytics and the importance of understanding and measuring your traffic. The resounding feedback I’ve gotten - and I wholeheartedly concur - is that Google Analytics remains the top used service but is far from satisfactory. Google Analytics is a fascinating product. Google acquired Urchin in 2005 and it remains one of the great, most overlooked internet acquisitions. They reportedly paid $30 million for Urchin.

Now Analytics is installed on nearly every website, gives Google insight into traffic patterns and integrates with AdWords and AdSense… thus enabling Google to upsell products through optimization and unified accounts. Brilliant.

But it also is a classic example of a product that really hasn’t changed because Google doesn’t have a great incentive to do so. It’s a free product, adoption seems to growing (at least from what I can tell) and the revenue association is around data and AdWords upselling (not enhancing the product).

Here are 20 ways to fix Google Analytics - taken from my frustrations and those I've heard / received from other users:

1. Provide an API. This turns Analytics into a platform, enables developers and allows me to define what I want to see.

2. Make it Real Time. I don’t care if this comes at a cost or how precisely real-time it is… but it’s a necessity. Right now, the only way to use Analytics is the day after - and the internet is increasingly about the now.

3. Enable Off-.com Tracking. This is huge. I’d like to be able to measure my ‘network’ data like Quantcast does. I could embed that code across my network’s content, widgets, and so on.

4. Bring Back Hourly Charts. I want to see in-day trends and data. Is my peak time at 12 noon or 5pm? This is important stuff that simply isn’t available.

5. Enable Exporting of the Entire Dashboard. I spent lots of time setting up my dashboard. Export the whole thing in a excel doc with tabs.... not just the pageviews.

6. Enable Multi-User Access to the Dashboard. I spent an hour customizing my dashboard. Why does everyone else in my company need to spend an hour as well?

7. Charting Customization. Seems simple right? I’d like to configure what the charts look like. What the scales are. The list goes on. The default charts are so distorted that you simply can’t figure out trends.

8. Add Dates to the CSV Export. Why do I have to add dates EVERY time I export data?!

9. Data Comparison With Other Websites. I have dozens of websites on Analytics. I’d like to compare them on basic stats like pageviews, visits, bounce rates, etc.

10. Add Trendlines. Trendlines are useful… particularly when graphs of overly distorted. A perfect use case: when the charts are moved from daily to weekly, the current week’s data should show a trendline / forecast rather than simply die.
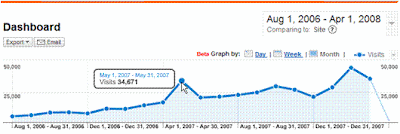
11. Add Day-Over-Day, Week-Over-Week, Month-Over-Month. When I hover over a data point, I should be able to compare it to the previous day, week or month. Maybe I can also customize which that is?

12. Associate Referrals, SEO with Content Pages. When I drill down to top content or directories, I’d like to know more than traffic numbers. Give me the top referrals to this page, SEO keywords, etc. Otherwise I have to spend 10 more clicks and wait a minute for each page load. Speaking of which:

13. Improve Site Speed. The site is getting slower by the week.

14. Improve the Dashboard. I’d like to name the 12 modules I have on my Dashboard. I’d like to also add links to my other regularly-used queries. Perhaps a light-iGoogle integration here?

15. Make it Social. Analytics is regularly used across companies. It would be terrific if the company could communicate on Analytics about trends, data, etc…. much like Google Docs. The comments can be RSS enabled and results can be emailed to the DL.

16. Email / Mobile Compatibility. I’d like scheduled reports that provide the basic information via email: pageviews, visits, etc (very different than current emailed exports). I’d like them via email so that I can access at scheduled times and on the go.

17. More Goals. More Goals. Goals are currently limited to three. More! If it’s costly, charge. People will pay.

18. Session Information. There isn't much depth around user / session pathing. What are the most common exit pages? How does that change when users arrive through SEO? Registered vs. unregistered users?

19. Metric Comparisons. Analytics allows charting of very high level information, like page views vs. visits. I'd like to be able to chart any two data points on a two-axis graph and compare different metric sets. For instance, I'd like to chart page x, y, and z against each other using page views / visit and bounce rate. That currently is entirely manual - finding, charting, and exporting.

20. Make Data Public (On Opt-In Basis). This is larger than a feature enhancement and is more strategic: allow websites to make their data public as a medium to promote themselves, gain new users and understand where they rank within their vertical. To have your data shared, you'd be hooked into Google Analytics and a richer ecosystem would exist (with new revenue opportunities). This enables the start of some major ideas:

Think Google Hot Trends + Yahoo Buzz + Quantcast + Blogger.